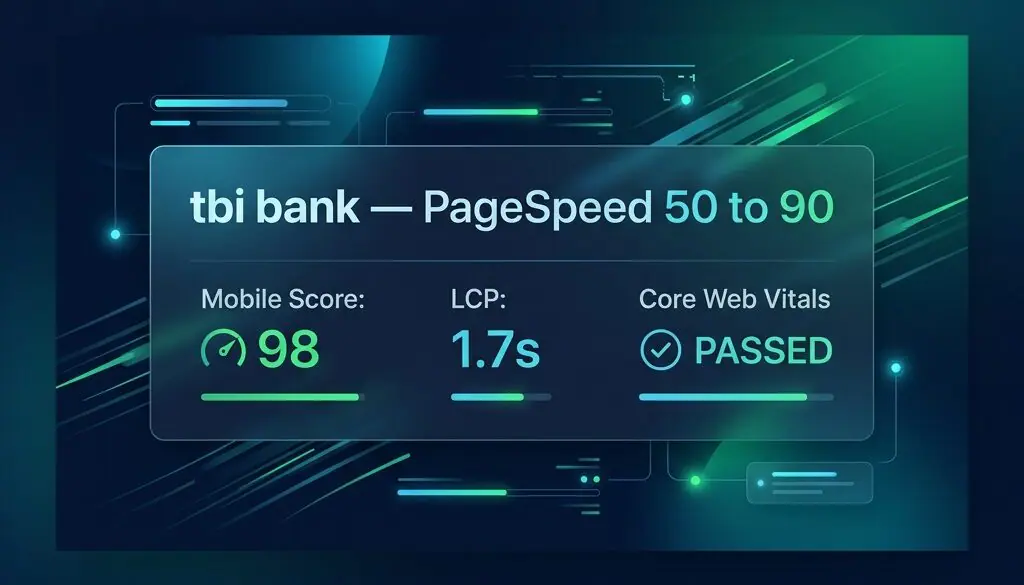
Case Study: Taking a 4-Country Bank Site from PageSpeed 50 to 90+
When a regional bank asks you to fix the loading speed of four production WordPress sites across four countries, the work is rarely a single optimization pass. More often it’s a months-long campaign: tuning, rolling out, recovering from regressions nobody warned you about, and building a plan that survives the next time someone touches the config.
This is a case study of exactly that kind of engagement. Over roughly fourteen months I worked with tbi bank — a consumer-finance brand operating across Bulgaria, Romania, Greece, and an international .com site — through their development partner, to bring mobile PageSpeed scores from the 50s into the 90s and keep them there. The headline numbers below are real values captured from PageSpeed Insights during the project, not reconstructed estimates.
The starting point
The brief in June 2024 was simple on paper: optimize LCP, FCP, and TTFB for a live website. The first site in scope was the Romanian domain, tbibank.ro, which at the time was still served from a staging subdomain (anagrama.tbibank.ro). A first diagnostic pass on PageSpeed Insights returned a mobile Performance score in the high 80s to low 90s, but the Largest Contentful Paint was unstable — sitting around 4 seconds and bouncing from one run to the next. On one representative run the score landed at 84 purely because LCP came in at 4s.
Two things stood out immediately:
- An unpredictable cookie-banner AJAX call. A consent plugin was firing an AJAX request against WordPress on every page load. Depending on server CPU pressure at that moment, it added anywhere from one to over two seconds — which is exactly why the LCP number bounced between tests.
- Render-blocking assets loaded everywhere. Frontend files from plugins like Contact Form 7 were enqueued on every page of the site, including pages that never rendered a form.
Those two issues — one third-party, one architectural — framed most of what came next.
First pass: getting staging into the 90s
The first round of changes was conventional but deliberate. WP Rocket was configured as the page-cache and asset-optimization layer. Render-blocking CSS was addressed with critical CSS, and the heaviest JavaScript was deferred until after first interaction. The cookie-banner script was delayed so it no longer competed with the initial render. Contact Form 7’s frontend assets were conditional-loaded only on pages that actually contain a form, rather than site-wide. And the theme’s web fonts were self-hosted, subset to just the Latin character set (four weights totaled roughly 75 KB of .woff2 versus ~297 KB for all subsets), and switched from font-display: swap to font-display: optional, which avoids the font-swap flicker that inflates LCP on slow mobile connections.
On 28 June 2024 the same staging URL returned a mobile Performance score of 98, with LCP coming down meaningfully from the ~4s baseline. The client confirmed the improvement and the change set was staged for production.

The lazy-load tension (and the 65-point lesson)
Speed work on a live marketing site is never just about the score. A month later a real constraint appeared: delaying the cookie banner and Google Analytics was great for Performance, but it broke the client’s measurement and compliance expectations. With both deferred, staging held at 92; the moment GA and the cookie script were pulled out of the delay, the same URL dropped to 86 in one test and then 65 on mobile once the client fully deactivated lazy-load to check — a 30-point swing from the same page.
That swing is the central trade-off of any third-party-script optimization: every script you defer helps the lab score, and every script the business insists on loading eagerly hurts it. The resolution wasn’t to pick a side — it was to load the bare minimum eagerly (the consent banner, so compliance was never blocked) and defer everything behind it, then accept that the headline number would land around 92 rather than 98. That’s an honest, stable target rather than a fragile peak.
The production regression: from 90s to 50
The most instructive moment of the whole project came on 26 August 2024. The staging configuration was promoted to the live tbibank.ro domain, and the client’s next PageSpeed run came back at 50 on mobile — lower than before any of the work started.
This is the classic staging-to-production trap, and it almost always comes down to one of three things: a cache that hasn’t warmed, a critical-CSS / Remove Unused CSS (RUCSS) job that hasn’t finished processing the new domain, or a server-level cache layer (in this case SiteGround’s own Optimizer plugin) fighting the page cache. Here it was all three. The fix was to disable the conflicting host-level cache, point WP Rocket’s RUCSS at the production URLs, and let the background job walk every page — which on this site was over 6,000 URLs of unused CSS to process. Within roughly two weeks the production score had climbed back to around 90/100 (the Bulgarian domain confirmed scores around 90/100 on 13 September), and the same configuration was then rolled out to tbibank.bg, tbibank.gr, and tbibank.com.
The wider lesson: staging scores are a promise, production scores are the receipt. Always budget time for the cache-warm and RUCSS-catch-up window after launch, and never declare victory until the live domain has been re-measured.

tbibank.com on mobile, captured 21 August 2024. Core Web Vitals passed in the green — the kind of receipt that confirms a rollout, not just a staging promise.The same staging-to-production trap hit the international domain within weeks of the rollout. On 30 September 2024 the client flagged that tbibank.com had slipped to 70+; a day later, after the same cache/RUCSS catch-up routine, it was back to normal. The field data for tbibank.com around that window told the same story the lab numbers did — Core Web Vitals assessed as Passed, with LCP at 1.7 s, INP at 178 ms, and CLS at 0.03. The dip was a configuration symptom, not a structural one, which is exactly why a cache warm fixed it inside a day.
When the WP Rocket config disappeared
Three months later, in early December 2024, a WP Rocket issue on the client’s side wiped the plugin’s configuration across all corporate sites at once — in their words, “we lost all of the configurations made before.” Performance collapsed overnight; by 5 December the Bulgarian domain had dropped to roughly 80/100 and the others followed.
Two things made this recoverable in hours rather than days. First, a WP Rocket settings export (.json) had been saved to the project chat precisely for this scenario — re-importing it under Settings → Tools restored the entire configuration in one step. Second, the recovery was paired with one more structural improvement: tbi’s Zendesk widget had been loading through Google Tag Manager, which meant it couldn’t be deferred independently of GA. Moving Zendesk out of GTM and loading it natively through WordPress made it independently lazy-loadable, and the Bulgarian domain was projected back into the low 90s.
If you take one operational practice from this post, make it this: export your cache plugin’s configuration to a file the moment it’s correct, and keep that file somewhere you can find it at 9pm on a Tuesday. Configuration drift is the single most common reason a fast site goes slow again months later.
What actually held over time
By the end of the engagement each of the four country domains was sitting in the high-80s to mid-90s on mobile PageSpeed Insights, with Core Web Vitals trending into the green over the weeks after each rollout as field data caught up to the lab results. The engagement closed with a five-star review and a thirty-minute call with tbi’s team on what the short- and long-term performance plan should look like going forward.
Looking back, the techniques that mattered most weren’t exotic:
- Conditional asset loading — only enqueue a plugin’s CSS/JS on the pages that use it.
- Honest deferred-script boundaries — load compliance eagerly, defer analytics and support widgets, and accept the resulting score rather than chasing a fragile peak.
- RUCSS with patience — let it process the full page set, and re-measure only after the catch-up window.
- Version-controlled cache configuration — export WP Rocket settings to a file so a config wipe is a five-minute restore, not a re-optimization project.
- Decoupling third-party loaders — pulling Zendesk out of GTM so each script can be tuned on its own merits.
The unglamorous truth of Core Web Vitals work is that most of the win is in the second ninety percent: the regressions, the re-measuring, the config exports, and the plan that survives someone else touching the server. That’s the work this engagement was made of.
Appendix: what was actually changed
For readers who want the concrete change set behind the narrative, here is what the engagement actually configured across the four domains:
- WP Rocket as the page cache and asset-optimization layer, with Remove Unused CSS (RUCSS) enabled and JavaScript execution delayed until after first interaction.
- A preload/RUCSS throttle helper — a small drop-in plugin that lowered WP Rocket’s preload batch size (45→10 URLs), stretched the preload cron interval (60→180 s), lengthened the delay between preload requests (0.5 s→6 s), and cut the RUCSS batch size (100→20). On a host with tight CPU limits this is what kept RUCSS from timing out on a 6,000-page site.
- EWWW Image Optimizer for a bulk PNG→JPG conversion pass plus WebP delivery, including the large hero carousel images that were ballooning LCP.
- Conditional Contact Form 7 loading — the form’s CSS/JS enqueued only on pages that actually render a form.
- Self-hosted, Latin-subset Inter fonts — four weights, ~75 KB of
.woff2total versus ~297 KB for all character subsets, served withfont-display: optional. - Zendesk decoupled from Google Tag Manager, loaded natively through WordPress so it could be lazy-loaded independently of analytics.
- Version-controlled WP Rocket exports (
.json) kept in the project channel, so the December config wipe was a one-click restore.
Need this kind of work on your site?
If your WordPress or Shopify site is stuck in the amber on Core Web Vitals – or was fast once and has slowly drifted back – that drift-and-recover cycle is exactly what I do. I work in measured passes, leave you with a documented configuration you can re-import, and report against the metrics that actually show up in your PageSpeed and CrUX dashboards. Get in touch and we’ll look at your numbers together.